How to use NG-Trace with the EIB driver?
Valid for NG-Trace library version 2.4.003 and newer.
We assum that you have correctly installed NG-Trace and the Fbox library
according to this instuction: www.engiby.ch/ngtrace/ngtrdnld.htm.
You have already created your EIB application and therefore, you have a S-Fup file with one of the EIB Driver Fbox.
1 – Open the S-Fup file with the EIB Driver Fbox. Before the EIB Driver
Fbox, place the Fbox called EIB Driver from the NG-Trace familly.
On the Fbox enter a free register (one single free register).
In the Fbox select the same channel as the one used by the EIB Driver.
![]()

2 – In the CPU, create a new file with the type NG-Trace. Important:
Uncheck the option 'Linked/Build'. The NG-Trace will open.
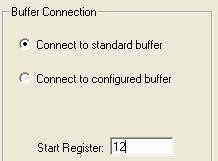
3 – In the Setings tab, select the option 'Connect to standard buffer'.
Enter the same start register as chosen above. Save the settings.
4 – Build, load and run your program as usual in the PG5 Project Manager.
During build, you should get these 2 messages:
NG-Trace Buffer for EIBDrv, channel
1 created.
EIB Driver : NG-Trace Buffer for EIBDrv
found.
5 - Go online with the PG5 Project Manager.
6 - In the View tab of the NG-Trace, press the Connect and the Start
buttons.

The named columns apears and the events are recorded. If the options are
checked, the PC Date, PC Time and PCD status are added.

The following values are traced:
- Date-Time Date and Time of the
event
- Function The executed
function or Error/Warning
- EW Code Error or Warning code.
The same info as in the Fbox
- Address The
concerned EIB address
- Value The sent or
received value
Read the Help
file for more explanation about the use of NG-Trace.
Back to NG-Trace download page.
Engiby / 25/05/2010